Compare ratios of different proteins in the same sample
not what we normally do with TMT data
TMT background
TMT is short for tandem mass tag. When you deal with proteomics data with large sample size (N >= 20), you are most likely dealing with TMT data. TMT is a very smart way to achieve efficient quantification of proteins. In a TMT10-plex experiment, 10 channels (or samples) are being quantified simultaneously, so that technical artefact is minimized (compared to doing 10 times separately).
Usually, you would have multiple plexes. Say you have 50 samples of interest, you may have more than 5 TMT-10 plexes in the experiment. How to control for the technial artefact between the 5 plexes? You may assign the last channel of each plex (or even more than 1 channel) to be a physical average of all the samples of interest. By doing so, you have a common reference in each of the plex, which to be leveraged in merging plexes together.
FragPipe , the best proteomics analysis platform, calculates a ratio between each channel to the reference channel, and these ratios then directly merged (think a join) across different plexes to generate a single data table, with each row being a gene/protein, and each column a sample.
Compare ratios horizontally between samples within a protein.
Now we are happy to see that within each gene (row), ratios can be safely compared between samples. You could conduct a differential expression analysis (DE) between groups of interest.
Compare ratios vertically between proteins within a sample.
But can I compare different genes within a single sample (column)? Would such analysis make any sense? I have to say, during my 3+ years experience of analysing TMT data, I never saw anyone directly performed such comparison, nor did anyone asked for such analysis. It just seems to be very weird!!! But let me tell you, it makes perfect sense!
Why? We subtracted the intensity of the bridge channel (physical average) from each channel, then the ratio is a relative measurement telling you how big or small this gene/protein is expressed for this sample, compared to an average level.
In fact, the bridge sample serves as a mediator in eliminating many types of biases such as ionization efficiency and also accounts for the stochastic nature of MS/MS.
Actually if we want to perform a ssGSEA (original method), we are going to use this ratio data.
A real example
I grabbed proteomics from a CPTAC lung squamous cell carcinoma (LSCC) project . In this dataset, we have both tumor samples and adjacent normal tissues (NAT). Supposedly, normal samples are more homogeneous to each other comparing to tumor samples (intertumoral heterogeneity). In the LSCC dataset, each plex was assigned with balanced tumor and normal sample channels. The bridge channels, i.e. a common reference, physical average of all samles, was used to adjust for between-plex difference (batch effect). We would expect the proteins expressed highly in one NAT sample relative to other proteins are also highly expressed in other NAT samples. To test it, I replace the actual ratios of protein for each sample with the ranks from high to low, I plot all the protein ranks against the rank of a randomly picked sample.
It looks like this:
![]()
The interpretation would be: if we randomly rank the protein ratios of one sample from high to low, then the sum of ranks over all the samples roughly goes from high to low as well, indicating it is justifiable to compare ratios of different proteins in the same sample.
I did a ssGSEA with the ratios and here is a heatmap visualizating the results:
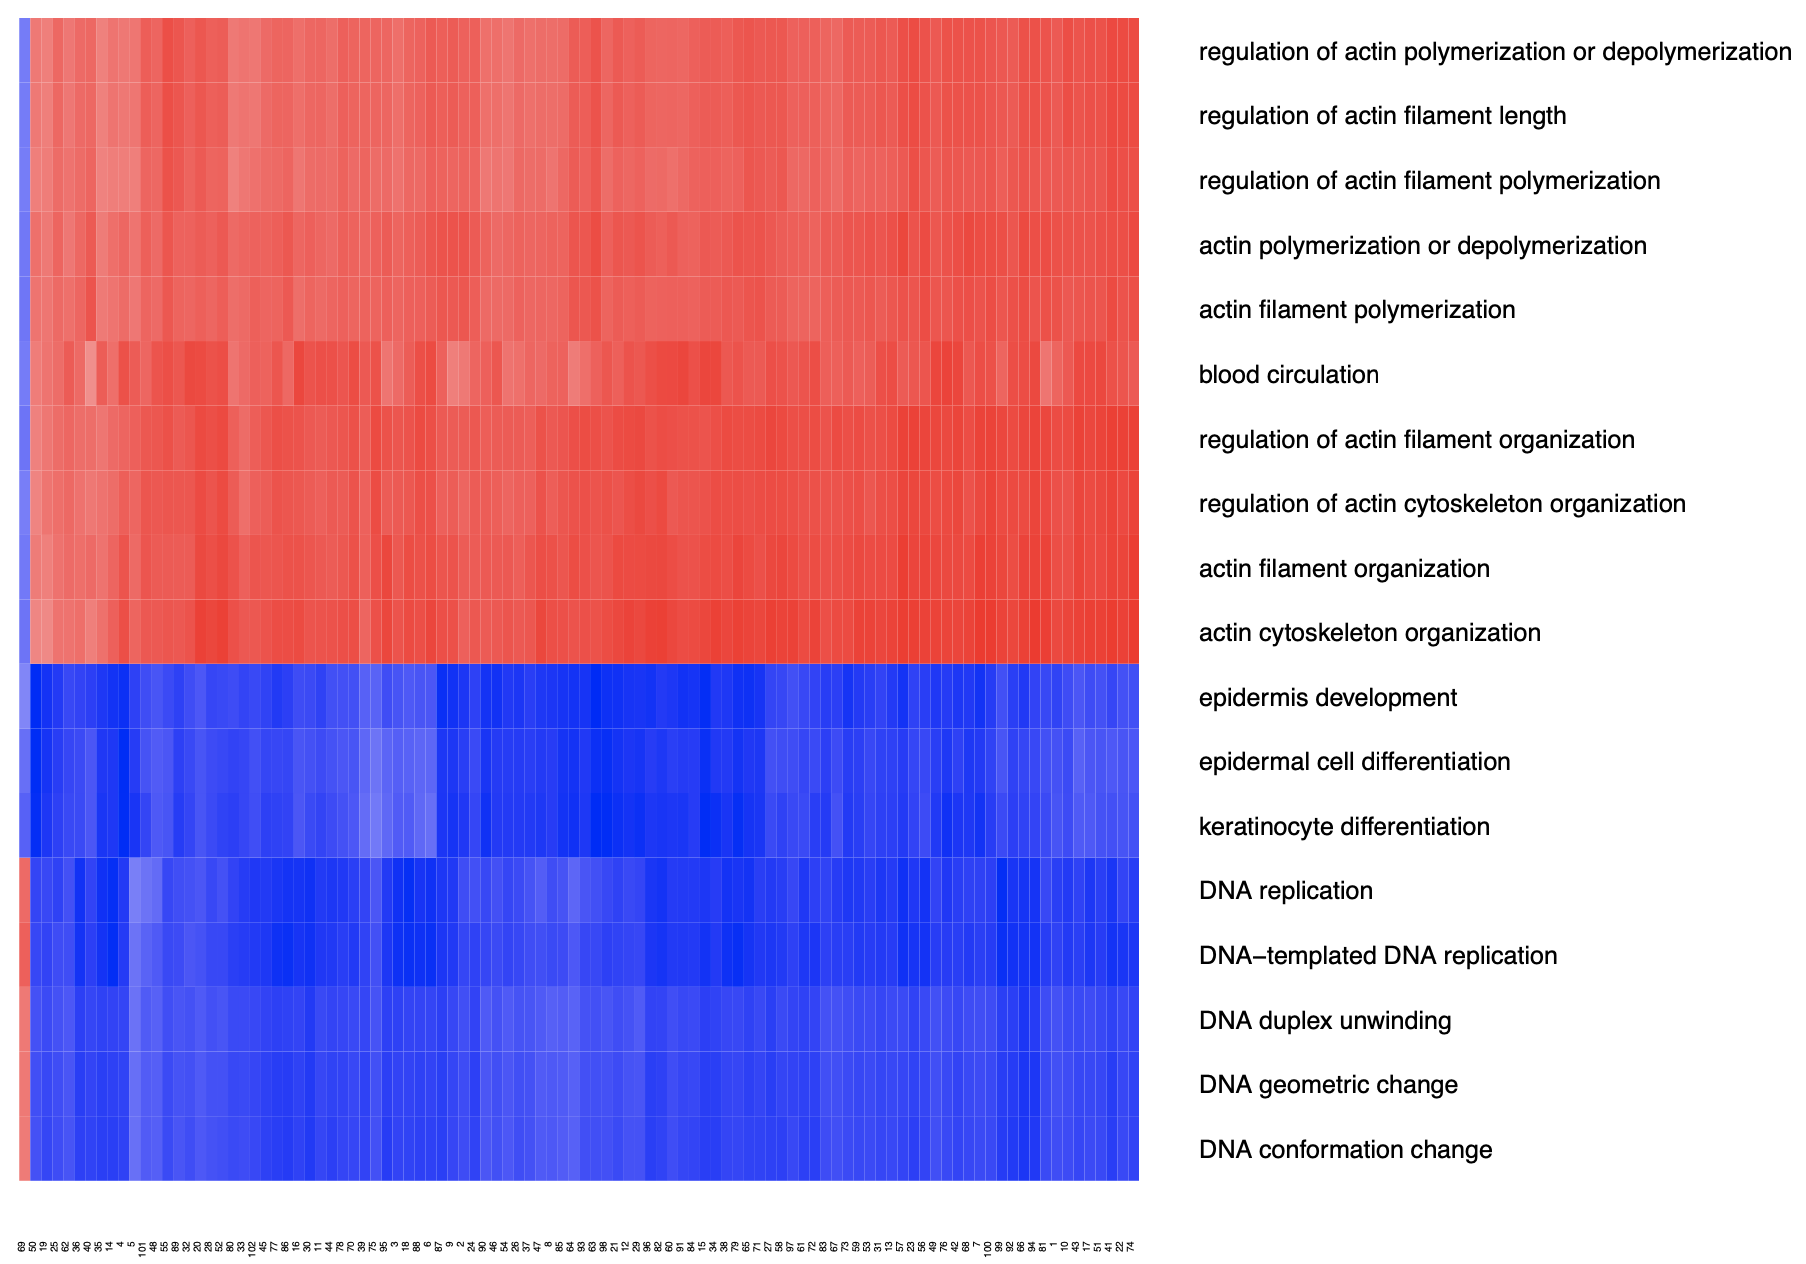
Ratios are “rankable” values across proteins. Notice that the left most patient was excluded in downstream analysis due to sample quality.