Capture net PTM changes with proteomics data
What many research groups are still missing.
Why post-translational modification (PTM)?
With the advance of PTM data acquisition technology, people are able to compare the PTM intensity between two groups of interest. One of the most seen PTM data is phosphorylation data. Signal transduction in key biological pathways rely on phosphorylation. For example, autophosphorylation of the C terminal of EGFR tyrosine sites are the start of epidermal growth factor signal transduction. In the scenario of Tumor vs Normal group comparison, it will be very informative to identify phosphorylation events that are significantly more intense in the Tumor group. Because, potentially and naively, if the abnormally high phosphorylation is causal, we could design kinase inhibitor to reduce the intensity of signal transduction.
Typical protocol in aquring both global proteome and phosphoproteome
The following diagram a typical CPTAC phosphoryaltion data acquisition workflow. 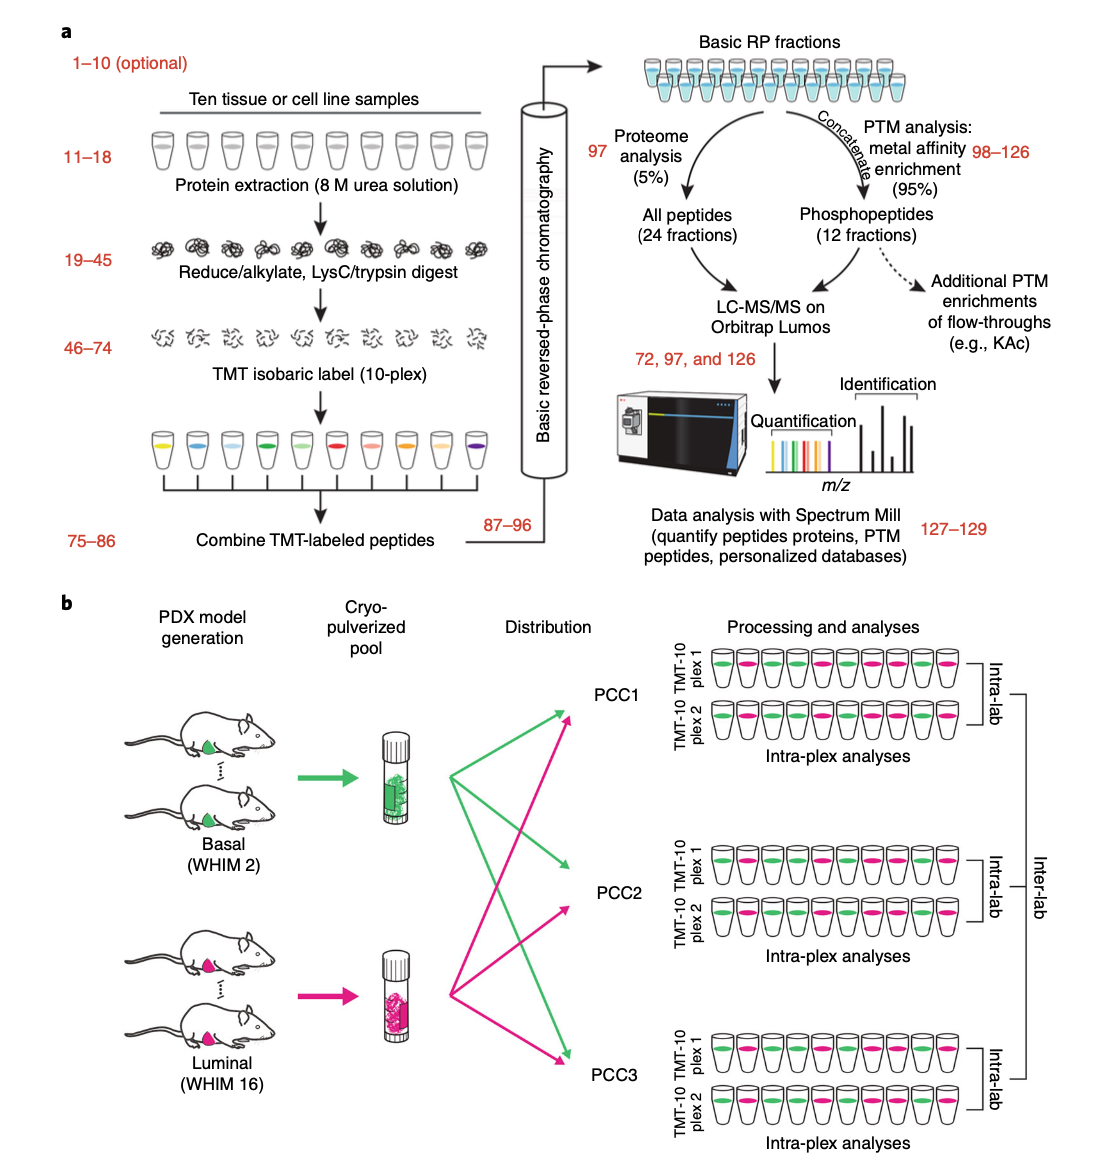
So you can see that phosphorylation is measured after TMT labelling. We make sure that the total amount of protein mass are equalized between channels, at least when at the pipetting stage, but there is no way to control for the same amount of total phosphorylation. On the other hand, for a certain phosphorylation intensithy comparison between two samples groups, we are not certain if the phosphorylation MS readout reflects real phospho difference or just the global protein difference.
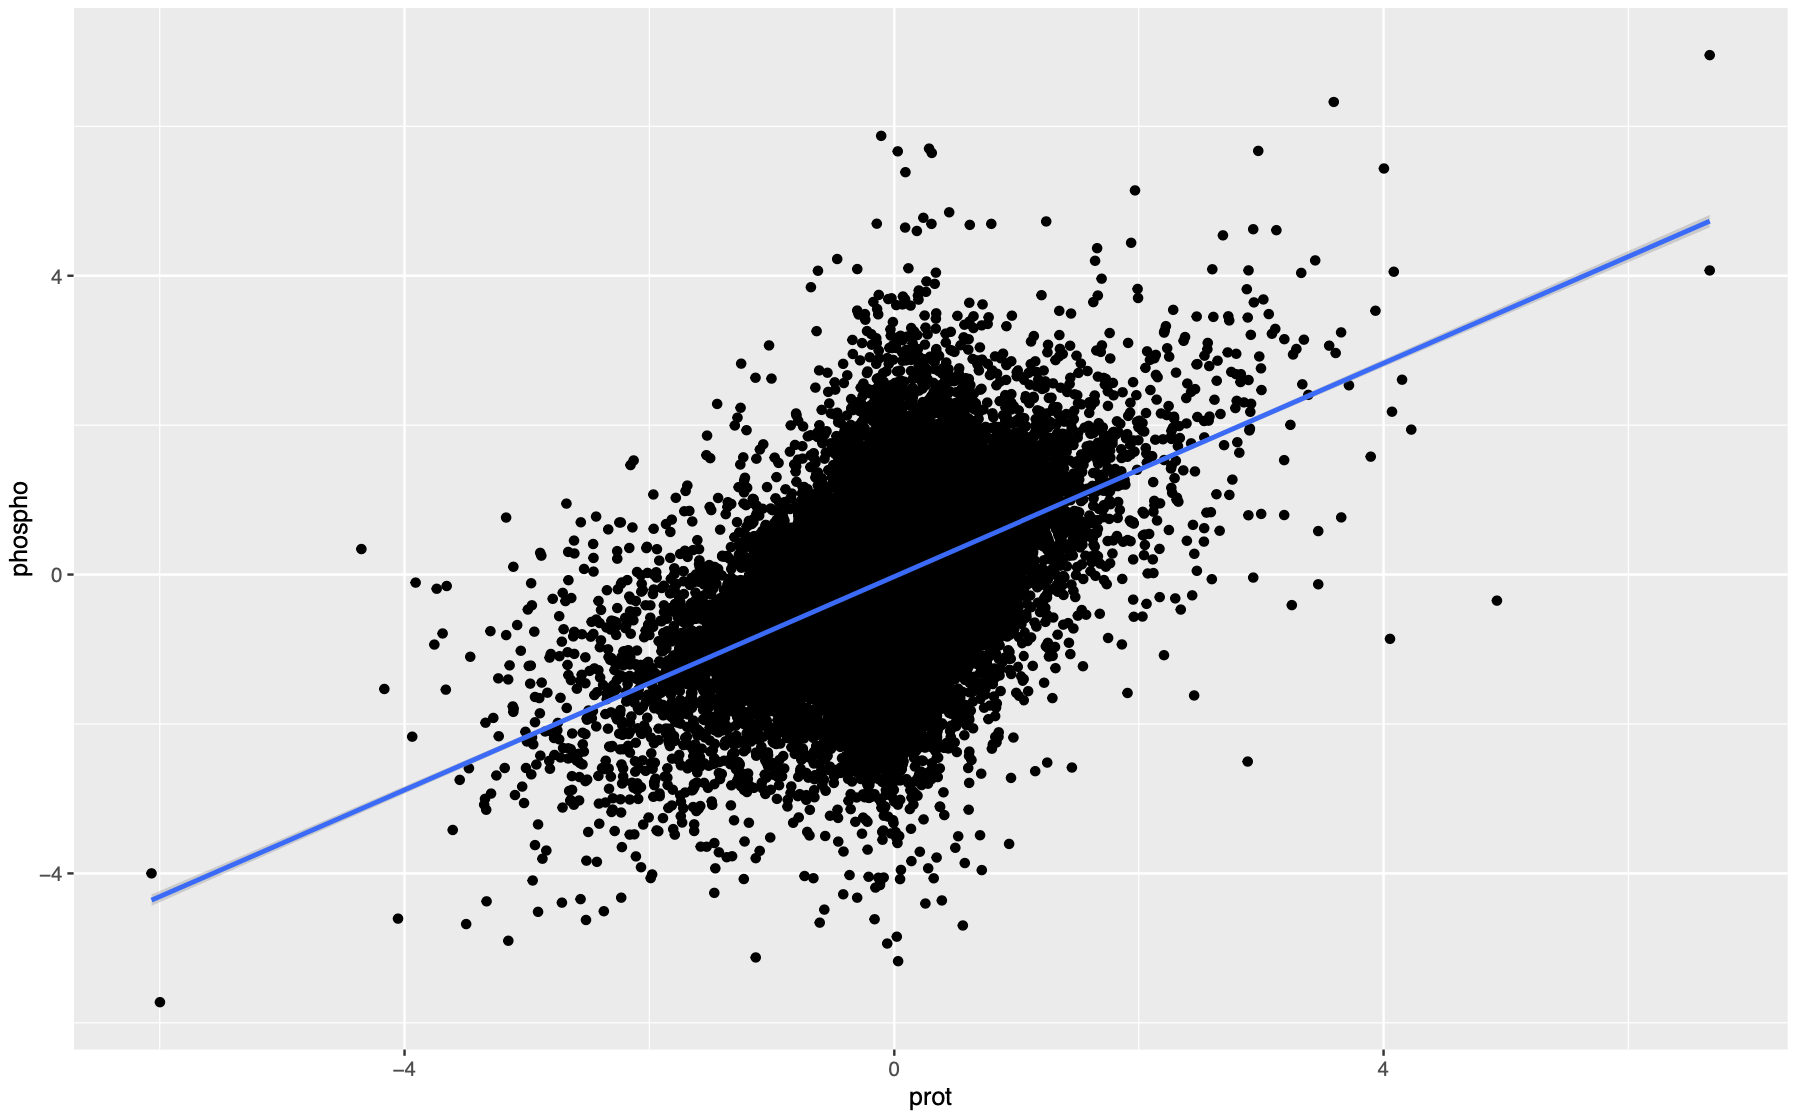
If we were to plot a scatter plot with protein abundance on the x axis and phosphorylation intensity on the y axis, across all the phosphorylation sites and all samples in a cohort, you would get a plot like this.
Normalization by regression
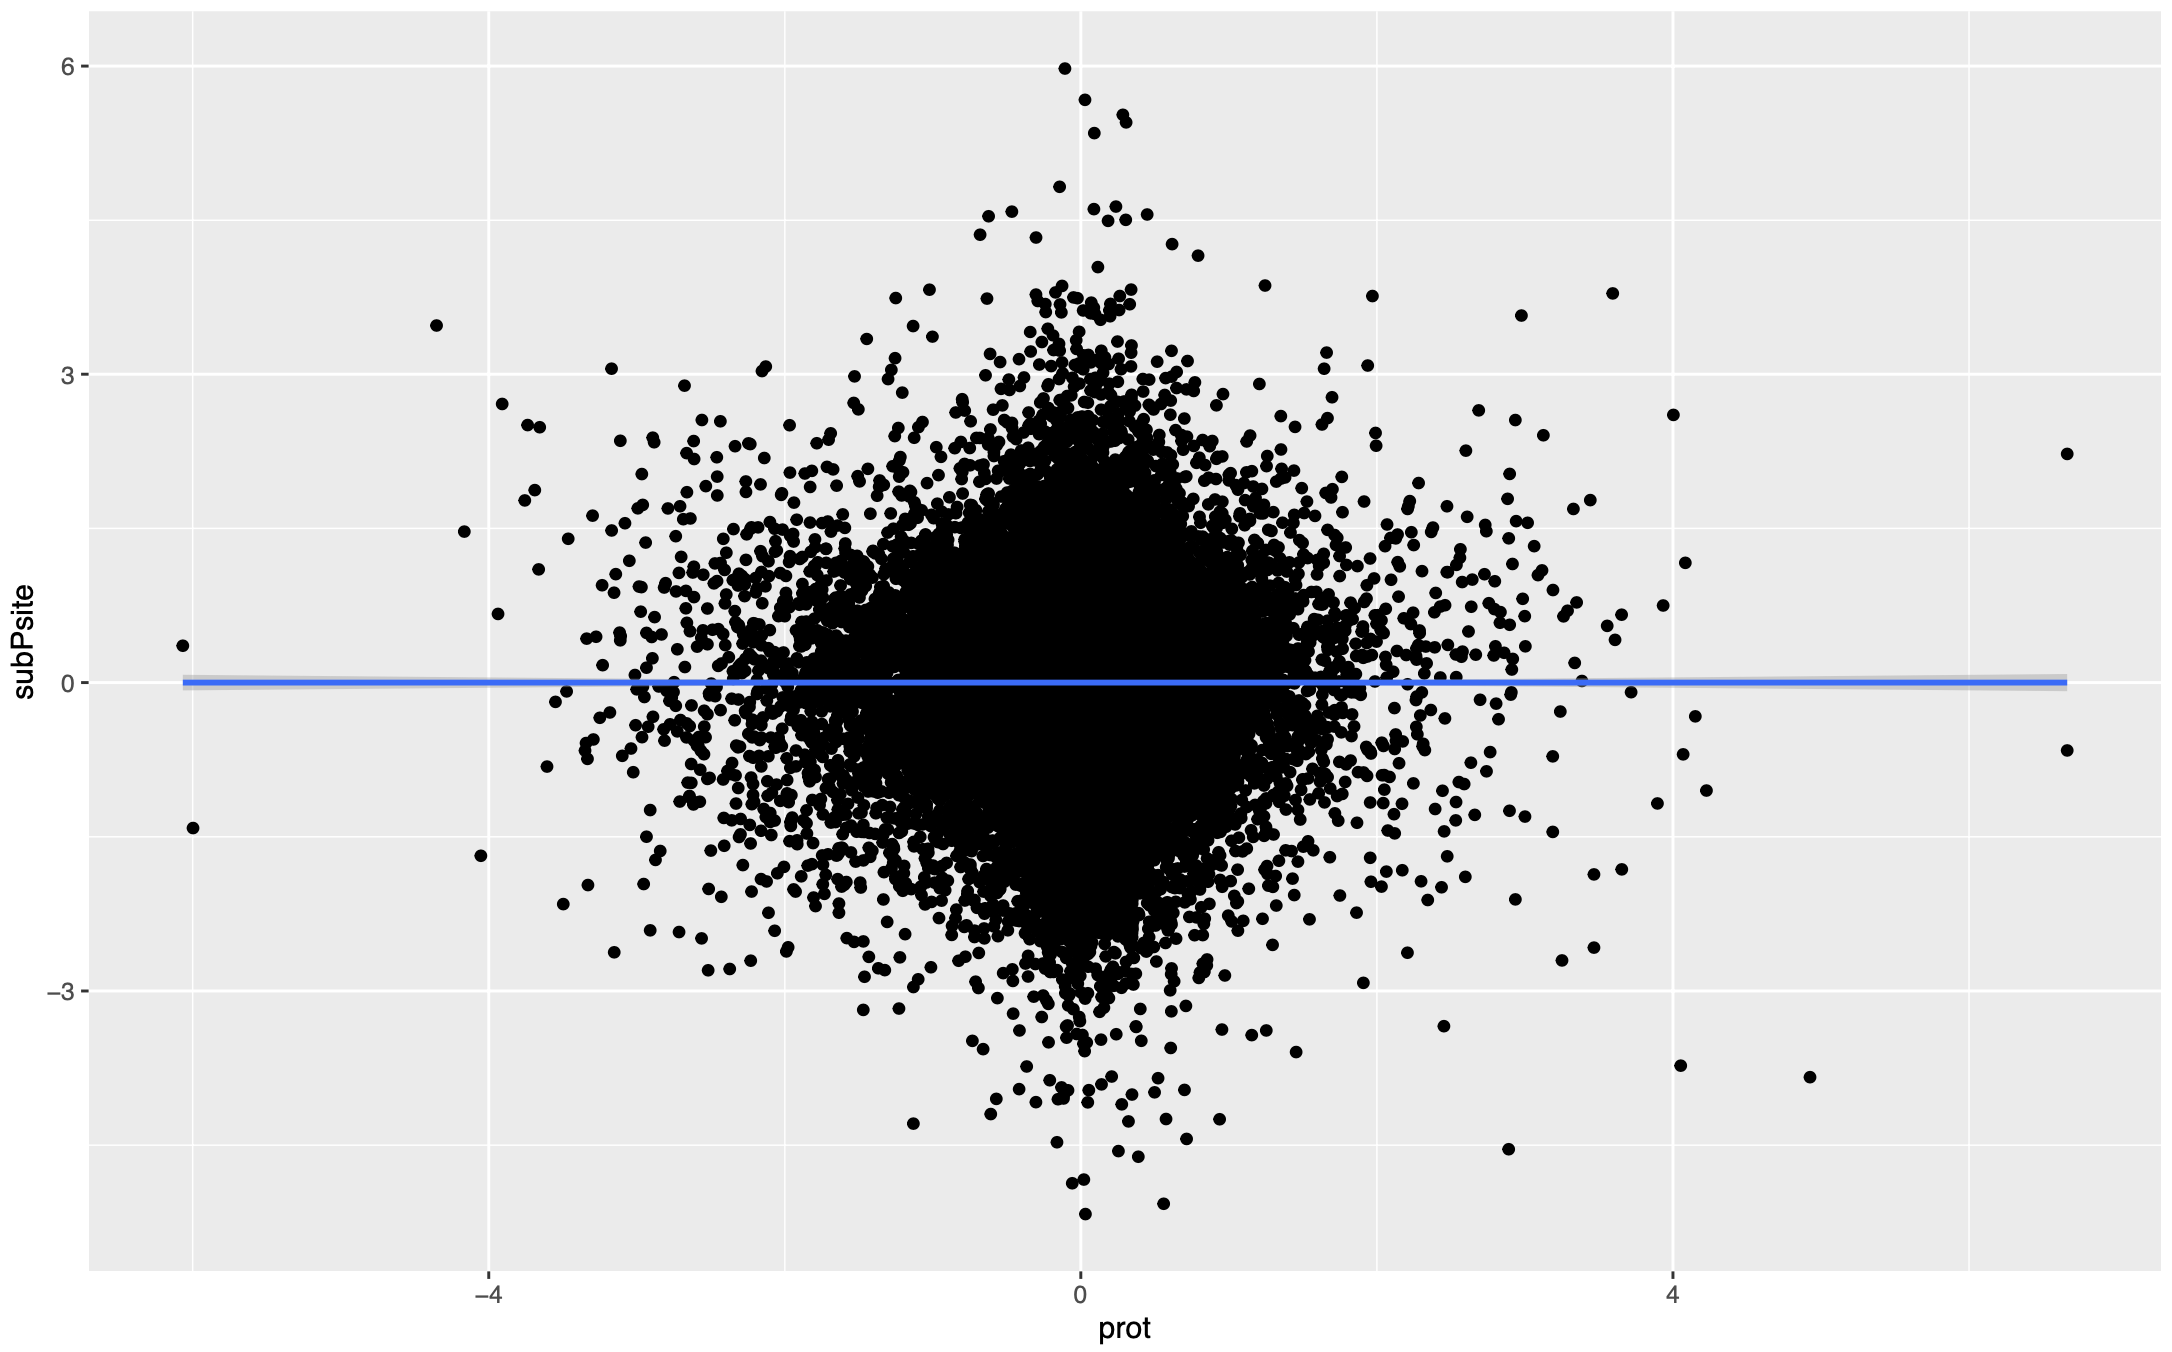
If we want to compare the net phosphorylation change, we can simply fit this relationship with a linear regression and the residual will be the normalized phosphorylation intensity. After fitting the regression, the residual is supposed to be randomly distributed against protein abundance, which is what we want to achieve. Additionally, this regression can be fitted for all the sites, for all the sites on the same protein, or for each site. I recommend doing it for all the sites across all the proteins for robustness.
Normalization by subtraction
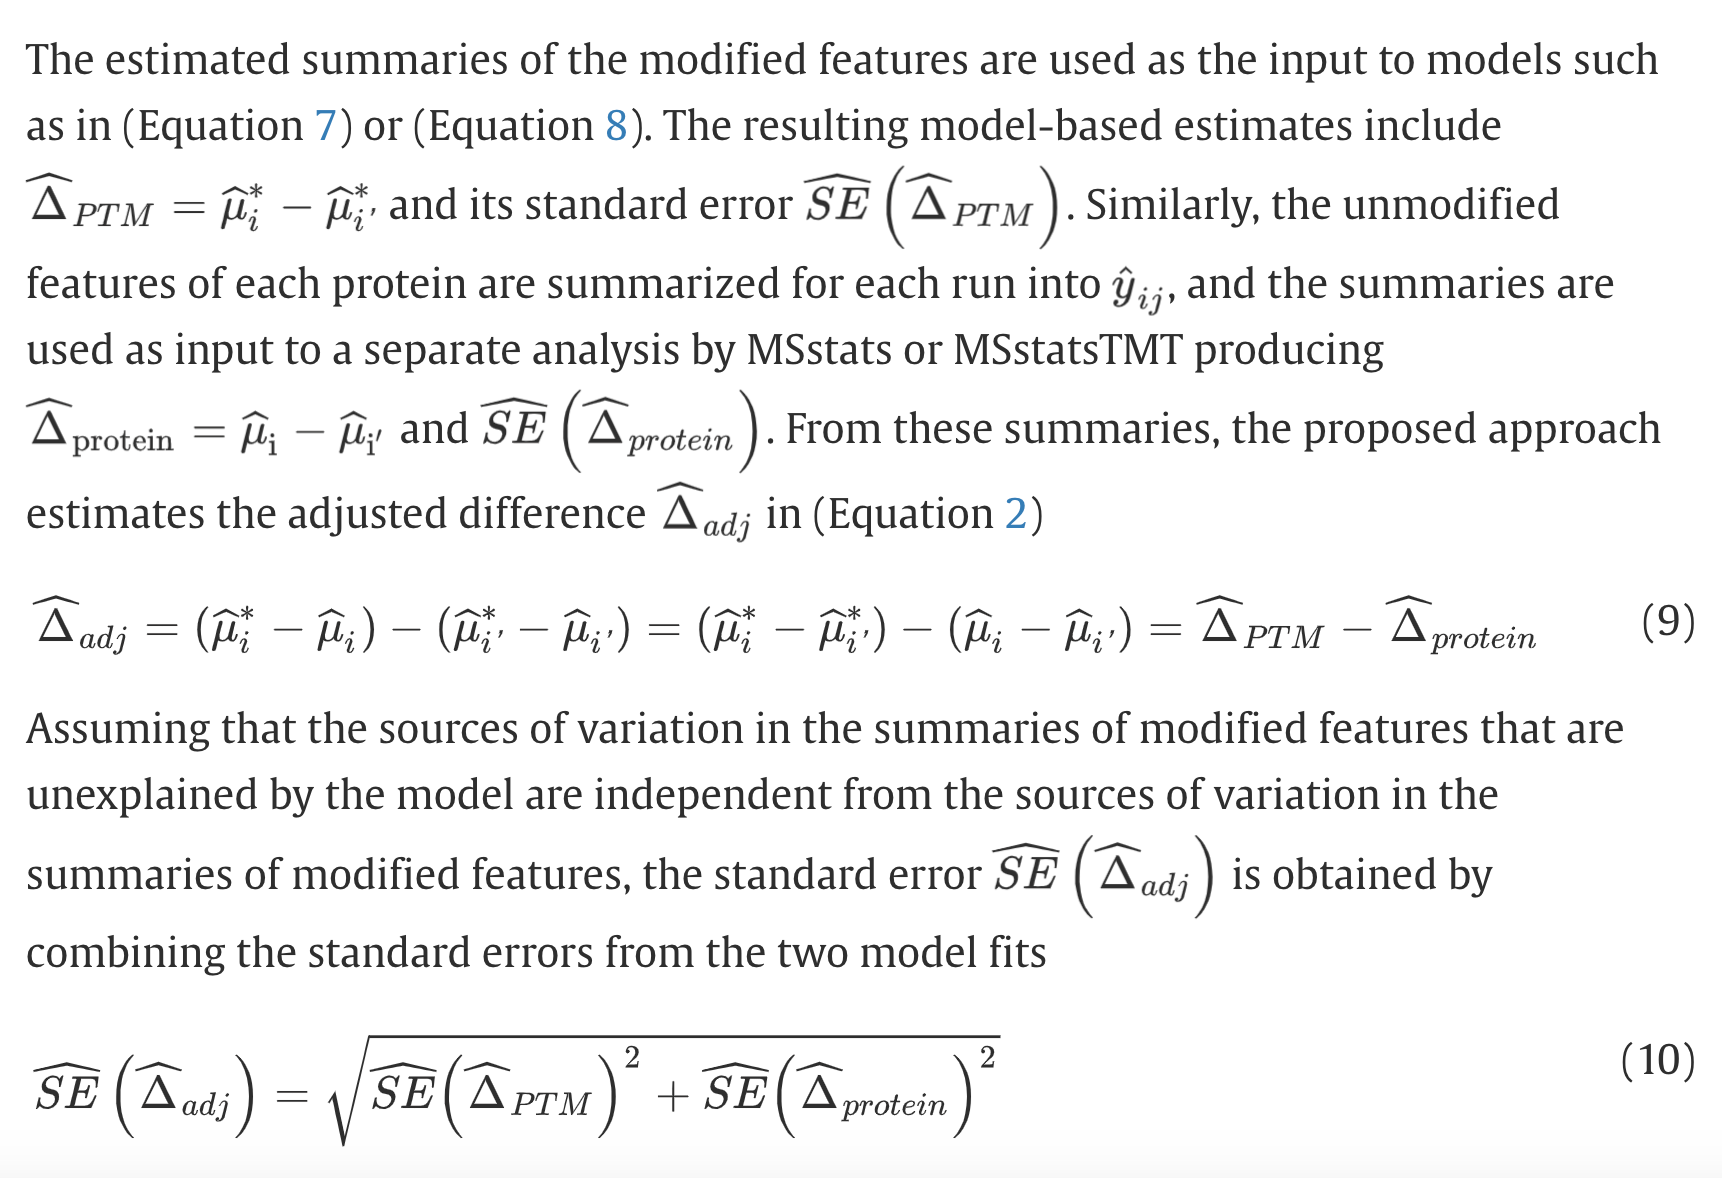
There is a simpler way to do this correction without fitting a regression. In the MSstatsPTM paper(Kohler, Devon, et al. “MSstatsPTM: statistical relative quantification of posttranslational modifications in bottom-up mass spectrometry-based proteomics.” Molecular & Cellular Proteomics 22.1 (2023)), mean protein abundance is substracted from the mean phospho intensity in both groups for each PTM site. Equivalently, this is the ratio between ratios (modifed and unmodified).
What is the major difference between the two approaches?
These two approaches are similar, if the coefficient from the regression is forced to be 1, then it will be basically the second method.
Suppose a scenario where at the first place, PTM intensity and protein abundance are not correlated at all. With the first approach, adjustment would be neglegible. But with the second approach, the adjustment would make much bigger difference, after the adjustment, PTM intensity maybe negatively correlated with protein abundance.
On the other hand, the second approach may not give enough adjustment if the coefficient is way larger than 1, which is not very likely though.
More readings
Why normalize: Wu, Ronghu, et al. “Correct interpretation of comprehensive phosphorylation dynamics requires normalization by protein expression changes.” Molecular & cellular proteomics 10.8 (2011)